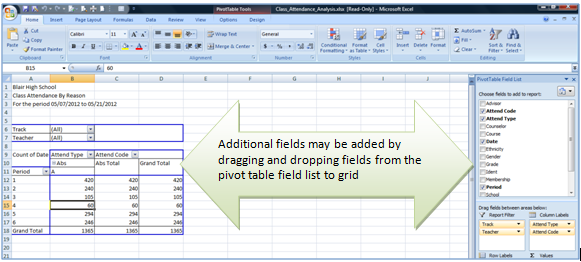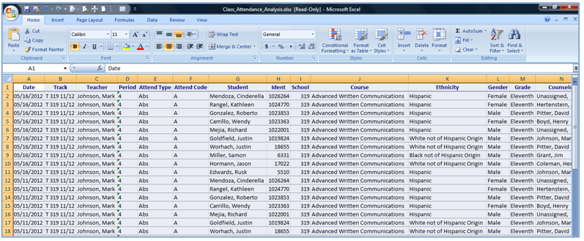
The Class Attendance Analysis default report produces a pivot table with student attendance broken down by attendance type and code. Additional data elements can be added by dragging and dropping fields onto the grid from the pivot table field list.
While details specific to this report will follow, users can find general information about reports within the Reports documentation. Most reports also include selection filters, and users can learn more about them in the Selection Filters documentation. Users can learn more about pivot tables in the Pivot Tables documentation.
Class Attendance Analysis Report is located within Reports in the Attendance menu in Q.
Report Options can be accessed by clicking the + sign next to Report Options, or by clicking the Options link on the right hand side of the screen.

- The Class Attendance Analysis Report provides for a user specified date range
- Enter the dates manually or use the pop up calendar to select dates.