The CA Monthly Accumulative Attendance report is useful for analyzing the accumulation of attendance month attendance data towards annual ADA, i.e. partial year attendance analysis. This is possible because any range of attendance months may be chosen, including single months as well as a range of attendance months up through the current attendance month.
It is important to understand that this report includes only daily attendance data. Hourly attendance data such as Continuation or Home/Hospital hours are not reported here.
Prerequisites:
- CA Attendance Summary Calculation run for the Apportionment period desired for the report. See CA Attendance Summary Calculation for further details.
While details specific to this report will follow, users can find general information about reports within the Reports documentation.
CA Monthly Accumulative Attendance Report is located within Reports in the Attendance menu in Q.
From Report Options, select:
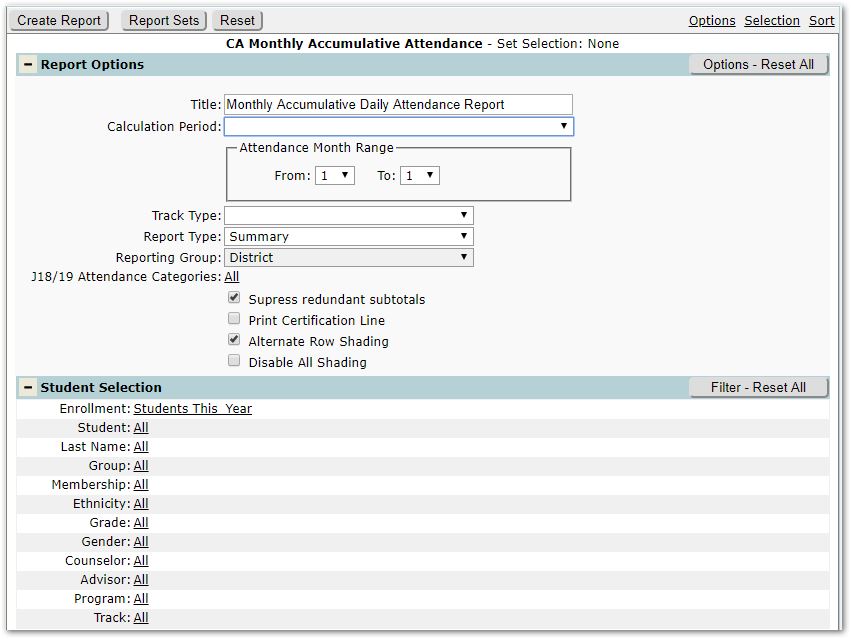
- Title – A default title is provided, but may be changed as desired.
- Calculation Period – Select from the periods in the drop list. The values in the list will be the Apportionment periods for which an Attendance Summary Calculation has been run.
- Attendance Month Range – Select the attendance month or range of months you wish to report.
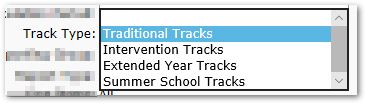
- Track Type – Select the type of track you wish to report.
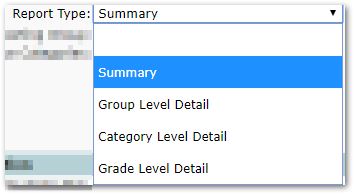
- Report Type – Select Summary or one of the three Detail reports: Group Level Detail, Category Level Detail, or Grade Level Detail.
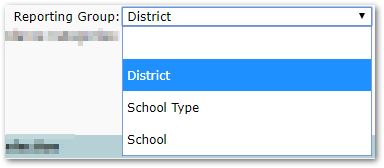
- Reporting Group – ‘District’ is the default Reporting Group. When one of the three Detail Report Types is selected Reporting Group is enabled. Select from District, School Type or School.
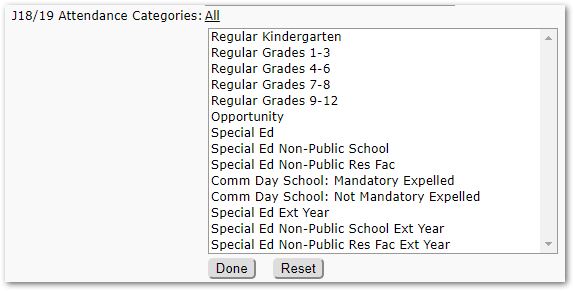
- J18/19 Categories – All is the default. If you wish to narrow the report, and filter on specific lines, you may select them here.
- Suppress redundant subtotals – This setting defaults ON. Uncheck if you wish to report all subtotals.
- Print Certification Line – Check to include a signature certification line at the bottom of the report.

- Alternate Row Shading – This setting defaults on. Uncheck to remove Alternate Row Shading.
- Disable All Shading – Check to render the report without any shading for heading lines etc.
Report Results
Summary Report for Traditional Tracks
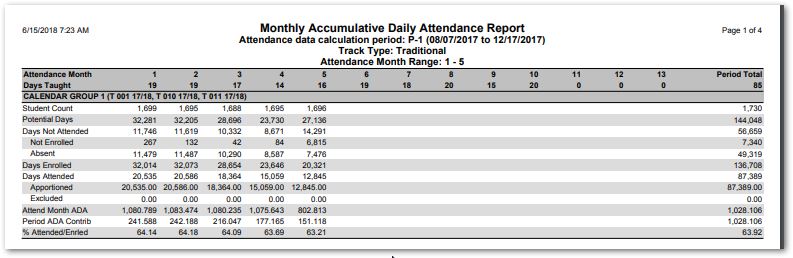
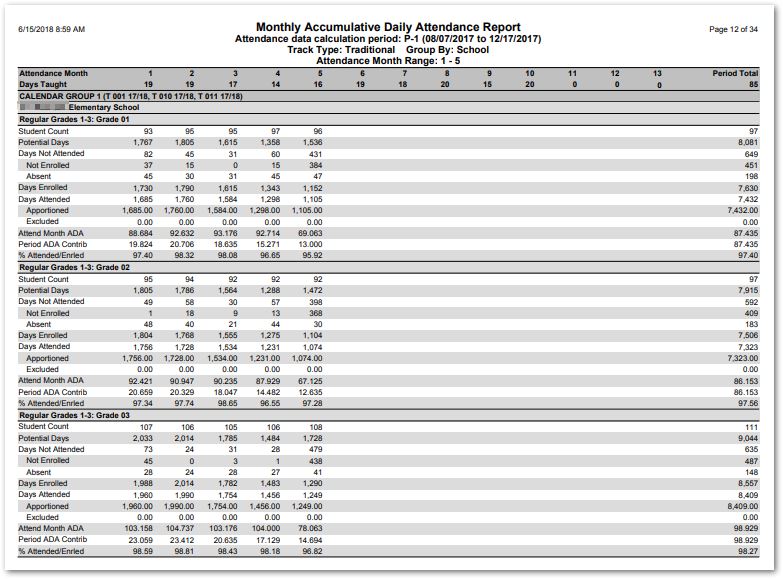
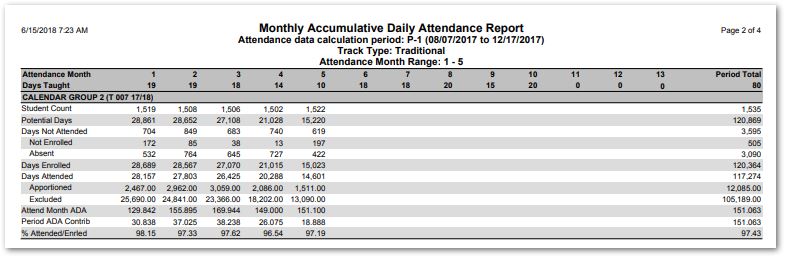
The report format shows for each Attendance Month across the top, the ‘Days Taught’ underneath the month. The report will automatically group tracks with common ‘Days Taught’ by month together as Calendar Groups. In addition, the report will automatically group K-8 / 9-12. User-selectable Report Grouping is another, optional, level of grouping (District, School Type, School) available for detail reports.
Down the left side are counts by group of the following items:
- Student Count – Count of students enrolled anytime during the attendance month.
- Potential Days – Student count multiplied by number of days taught in the attendance month
- Days Not Attended – Number of days not enrolled plus the number of days absent.
- Days Not Enrolled – The number of potential days minus the number of days enrolled.
- Days Absent – Days absent during the attendance month.
- Days Enrolled – Days enrolled during the attendance month.
- Days Attended – Number of apportioned days divided by the number of days taught in the attendance month.
- Apportioned – Apportioned daily attendance.
- Excluded – The number of days attended minus days apportioned. Excluded attendance consists of attendance ineligible due to not meeting enrollment requirements, partial day’s concurrent college enrollment, and partial day’s concurrent ROP/C attendance.
- Attendance Month ADA – The number of apportioned days divided by days taught in the attendance month.
- Period ADA Contrib – Number of apportioned days divided by the number of days taught in the specified period.
- % Attnded/Enrled – The number of apportioned days attended divided by the number of days enrolled.
Note: Student count may vary based on the report level at which it is calculated.
For example, a detail report based on grade-level would count the same student twice if his grade-level changes in the middle of an attendance month; a similar report selecting category detail would only count that student once. A detail report based on category would count a student twice if he moves from one category to another during the attendance period, while a detail report based on report grouping by district would only count him once. However, because the outer-level grouping totals are based on (summations of) the values in the innermost level, the category totals in the two reports in the first example will not match, and the district totals in the two reports in the second example will not match. Only the student count, potential days, days not in attendance, and days not enrolled values are affected by this approach. The other values, including the ADA calculations and attendance percentage, are not affected by student count, and will not vary no matter what level of detail is selected.
Summary Report
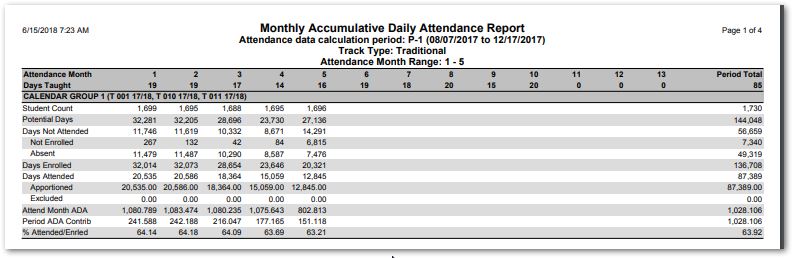
The summary report provides a single set of summary data for each attendance month plus the period totals for the data included by the report. If the selected tracks all reference matching calendars, one group of data will be presented; but, as mentioned previously, if differing calendars are referenced by the tracks, multiple groups of data will be presented which include data for each calendar layout.
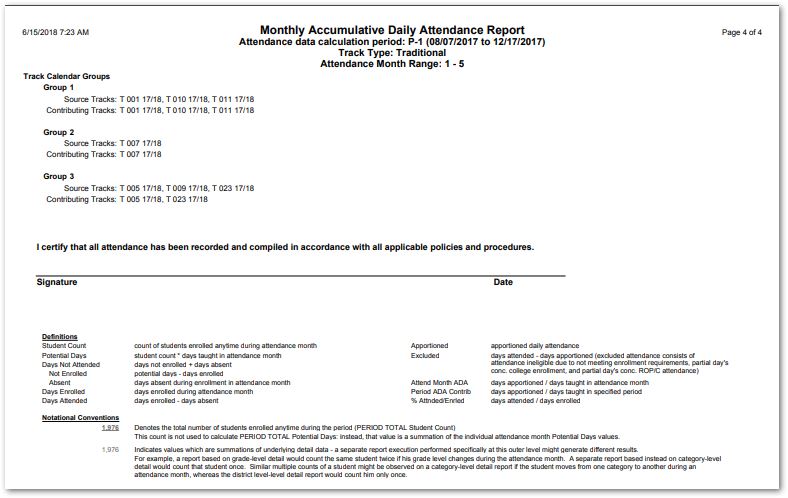
In the sample pages shown below, note that the first two pages show Calendar Groups 1 and 2, while the last page shows the break out of Track Calendar Groups, the optionally included Certification Line, Definitions and Notational Conventions.
Detail Report
In the example shown below, the report was run for Traditional Tracks, grouped by School for Grade Level detail.