The Class Enrollment Analysis default report produces a pivot table with student enrollment broken down to show regular students and special education students. Additional data elements can be added by dragging and dropping fields onto the grid from the pivot table field list.
While details specific to this report will follow, users can find general information about reports within the Reports documentation.
Class Enrollment Analysis Report is located within Reports in the Schedule menu in Q.
- The Class Enrollment Analysis Report can be run:
- To include Only Attendance Taking Classes.
- To include Only Homeroom Classes.
Class Enrollment Analysis Report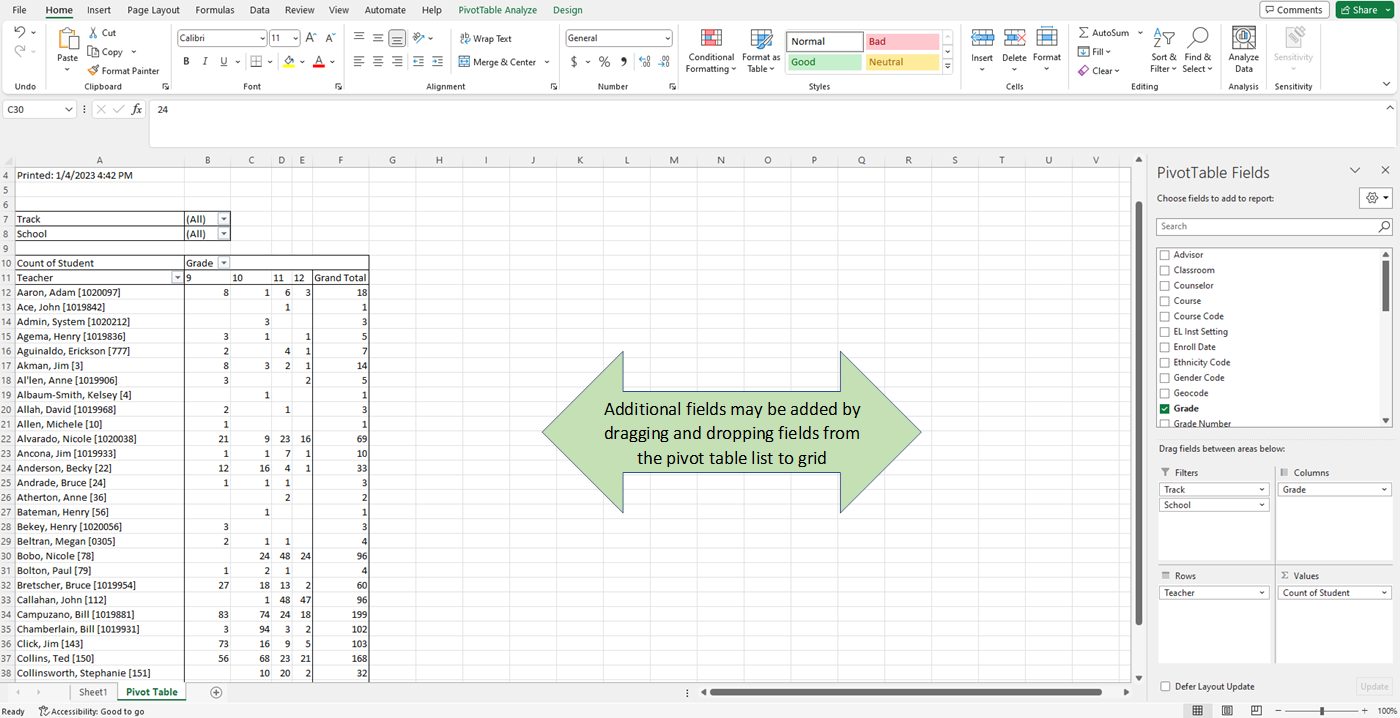
Double clicking on a cell will open a new worksheet displaying a roster with the individual student records represented by the count.
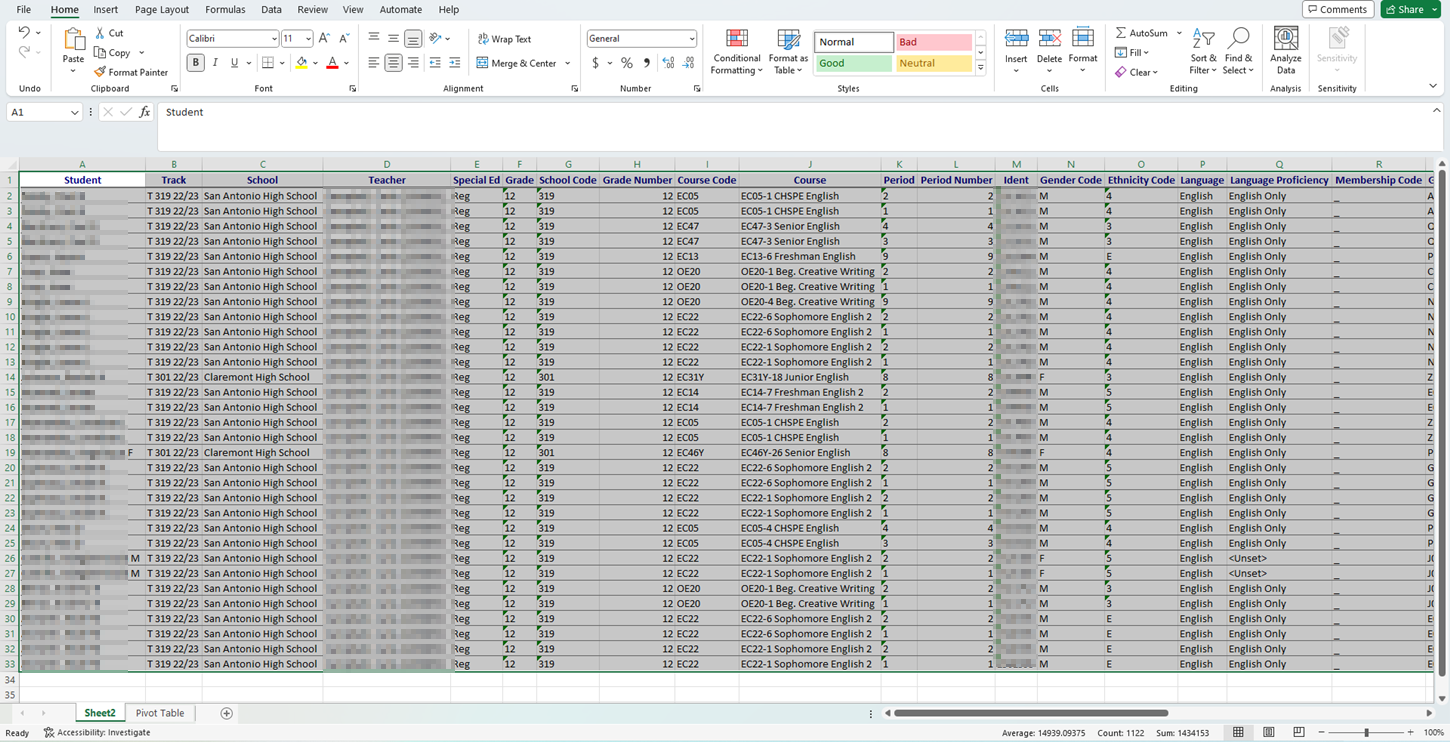
To return to the home pivot table click the Pivot Table tab.

NOTE: Reports may look different depending on options, selections and sort order choices.