
The Q Program Enrollment Analysis report produces a pivot table displaying counts of all Special Program enrollments. Data returned can be configured by the user to include all special programs or selected programs. The pivot layout is also configurable with a wide selection of fields available for use for page, row or column data. This report will only access data from non-special education programs; a separate report is available for special ed analysis.
The Program Enrollment Analysis Report can be run from the school or district level. When logged into a school, only data for that school will be returned. When logged into the district, data for the entire district will be returned.
While details specific to this report will follow, users can find general information about reports within the Reports documentation.
Program Enrollment Analysis Report is located within Reports in the Programs menu in Q.
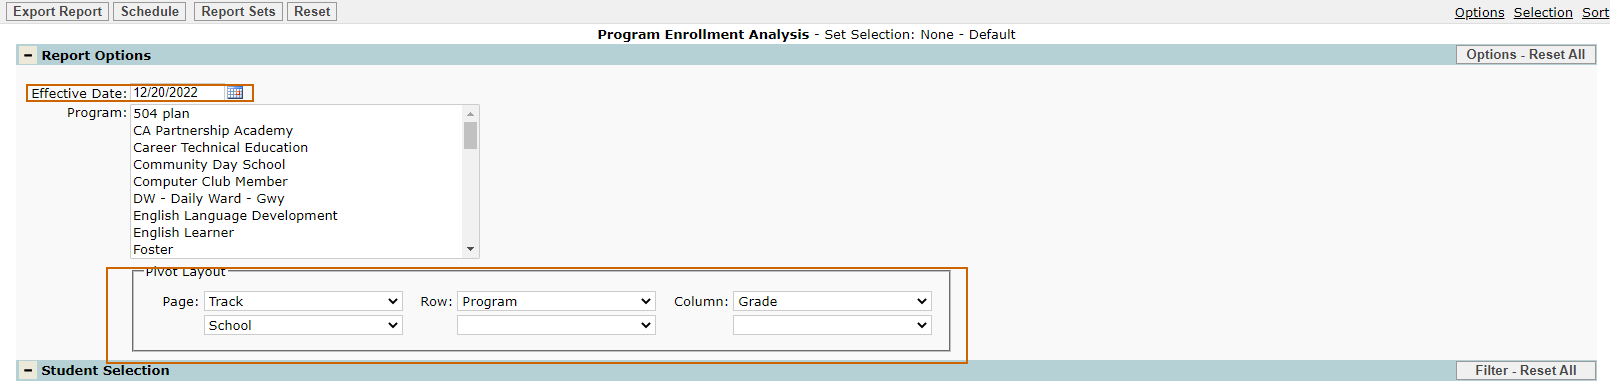
When initially launched the Report Options default to the current date and all programs. The default pivot layout is as follows: Page; track and school, Row; program and Column; grade.
Users may select the date, program(s) and pivot layout of their choice from the following report options:
- Effective date:
- Enter the dates manually using the MM/DD/YYYY format or use the pop up calendar to select the date.
- Select Program:
- Clicking the All button displays a list of available programs. Multiple programs may be selected by holding the Cntrl button down while clicking on the Program Name. When all selections have been made, click Done.
- When multiple programs are selected the data returned includes all students who have a record in all selected programs. It does not filter the students to show only those students who have records in the combination of programs selected.
Note: Programs appearing in the list are tied to the user’s permissions. If a user does not have access to a program it won’t appear in the list. 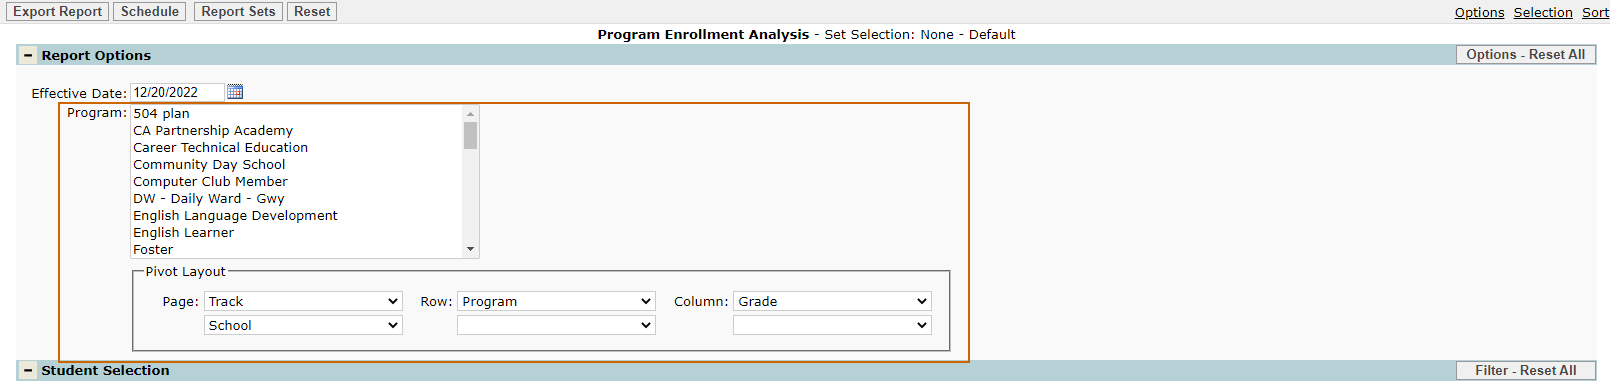
- The Pivot Layout may also be adjusted to the user’s specifications by selecting items from the Page, Row and Column drop down lists.
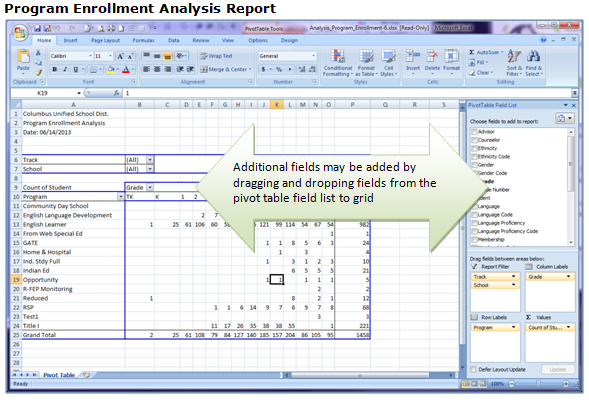
Double clicking on a cell will open a new worksheet displaying a roster with the individual student records represented by the count.
Records initially displayed in the drill-down are not sorted in any particular order. To determine the data sort order:
- Select the data tab in the spreadsheet ribbon.
- Select the column you wish to sort.
- Click the ascending or descending arrow.
- If you highlight only one column, you will receive a message asking if you want to expand your selected sort option.
- Click Expand the Selection.
- Click Sort.
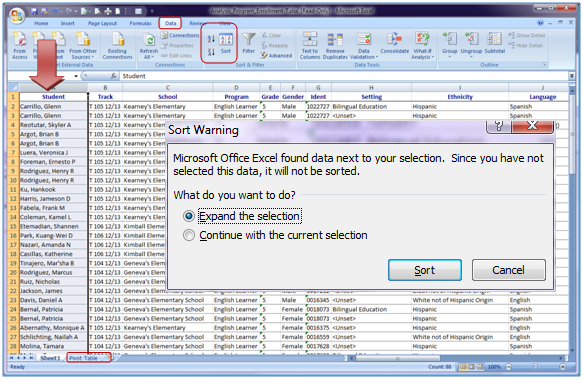
To return to the home pivot table click the Pivot Table tab.

NOTE: Reports may look different depending on option and selection choices.