
The Q Eligibility Analysis allows users to create a Pivot Table report that shows Food Service Eligibility Counts on a given day by a wide variety of possible demographic filters and then based on the count configuration, see the student demographic information in a spreadsheet.
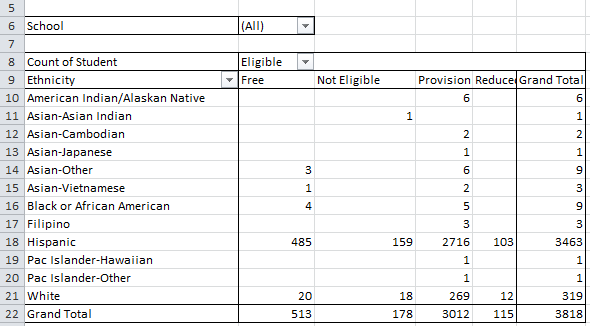
While details specific to this report will follow, users can find general information about reports within the Reports documentation.
Eligibility Analysis is located within Reports in the Food Service menu in Q.
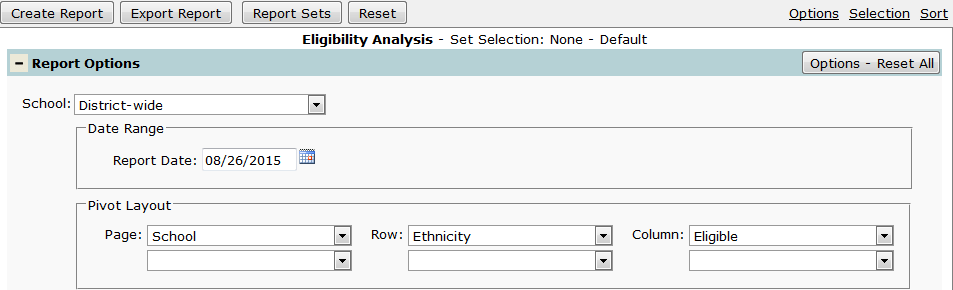
The Report Options allow the user to organize the way the data will look on the Excel Pivot Table.
The example below overlays the Report Options onto Excel to see where they appear on the Pivot Table.
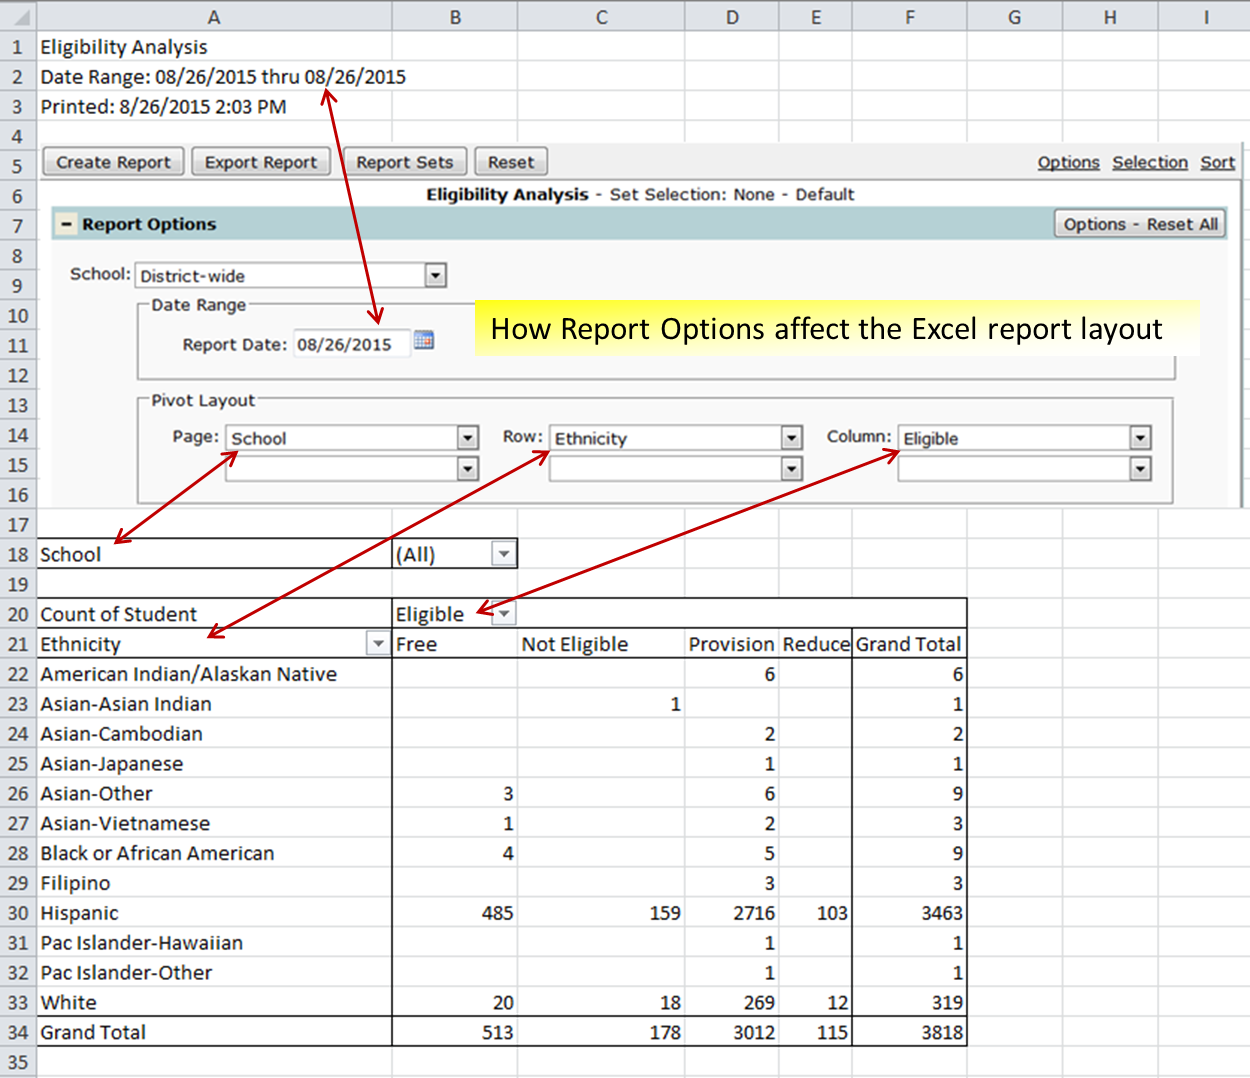
Adjusting the layout of the data in Excel is as easy as drag and drop.