
Designed for analyzing and reporting the number of EC students added or dropped in the selected Program, by Pay Type, for the defined Date Range, this report opens an Excel Pivot table.
While details specific to this report will follow, users can find general information about reports within the Reports documentation.
EC Adds & Drops Summary Report is located within Reports in the School menu in Q.
The EC Adds Drops Summary offers the following options:
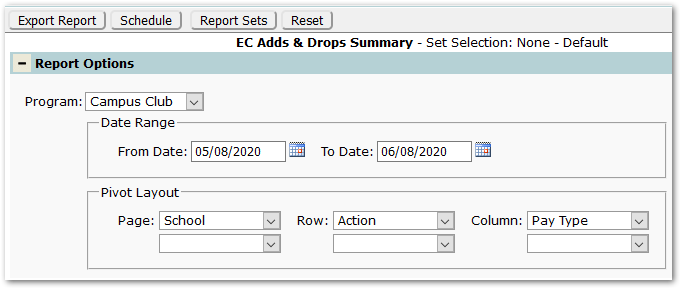
Program – Select a Program to report. Programs available for selection may be defined by permission.
Date Range- Set a date range for the report.
Pivot Layout - The Pivot Layout may be adjusted by selecting items from the Page, Row and Column drop down lists.
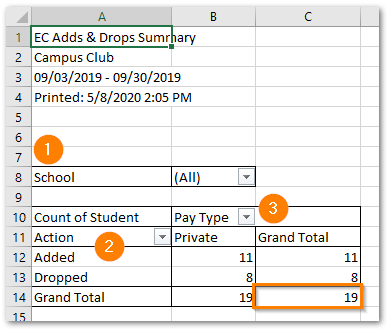
In the sample pivot table report, the Pivot Table Layout sections correspond to locations of on the report: 1 – Page set to ‘School’, 2 – Row set to ‘Action’ (Add/Drop), and 3 – Column set to ‘Pay Type’.

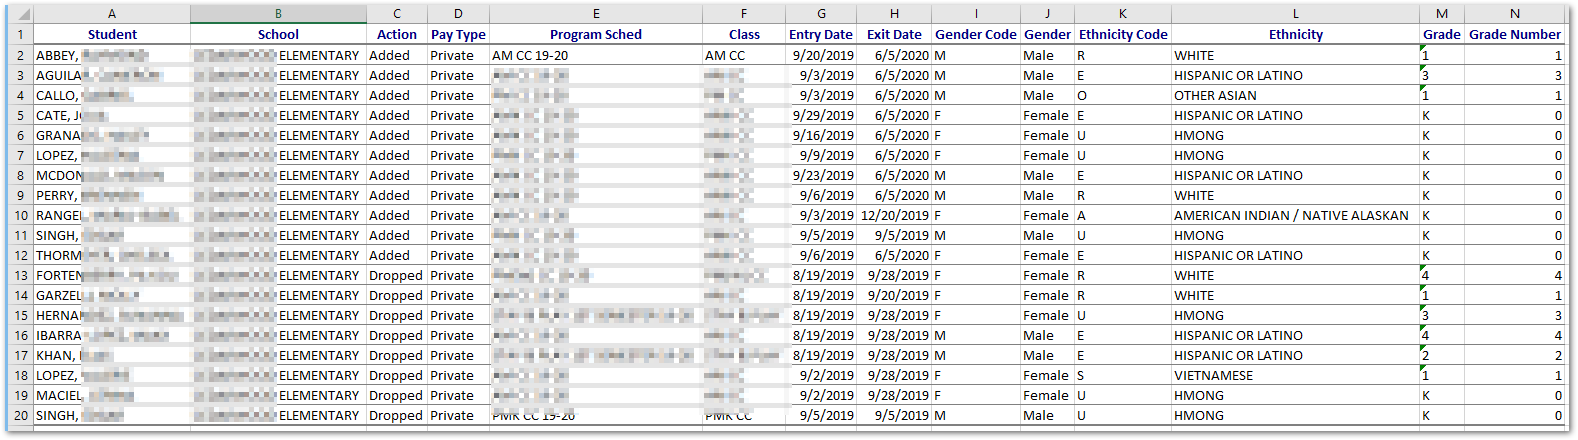
To see detail information of the students who make up any total, click a total. In this example, the highlighted grand total of ‘19’ is selected. When clicked, a new worksheet opens with the details showing the students counted in the total.
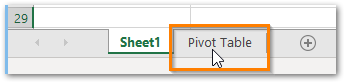
To return to the pivot table, select the ‘Pivot Table’ sheet at the bottom of the page.
To change the rows, columns or page (filtering) of the report, there are two options:
- Click in the report to see the Pivot Table Field dialog
- Re-run the report selecting different values in the Pivot Layout options.