
This report is a master schedule analysis which takes a count of how many students have requests in each period and uses a statistical averaging approach that compares student requests for courses against the section sizes of the courses. Student requests are for a particular course, but not for a particular meeting time. The report processing takes the requests for each course, finds the meeting times for that course in the master schedule, and allocates the number of requests to the meeting times proportionally. The proportional request counts are calculated using the ratio of the section size to the sum of all section sizes for the course. If the number of requests for a particular course exceeds the total section size for all sections for that course, then the number allocated to each section is the actual section size.
While details specific to this report will follow, users can find general information about reports within the Reports documentation.
Master Schedule Request Balance Analysis is located within Reports in the Schedule menu in Q.
Master Schedule Request Balance Analysis Options enable the user to select or set: 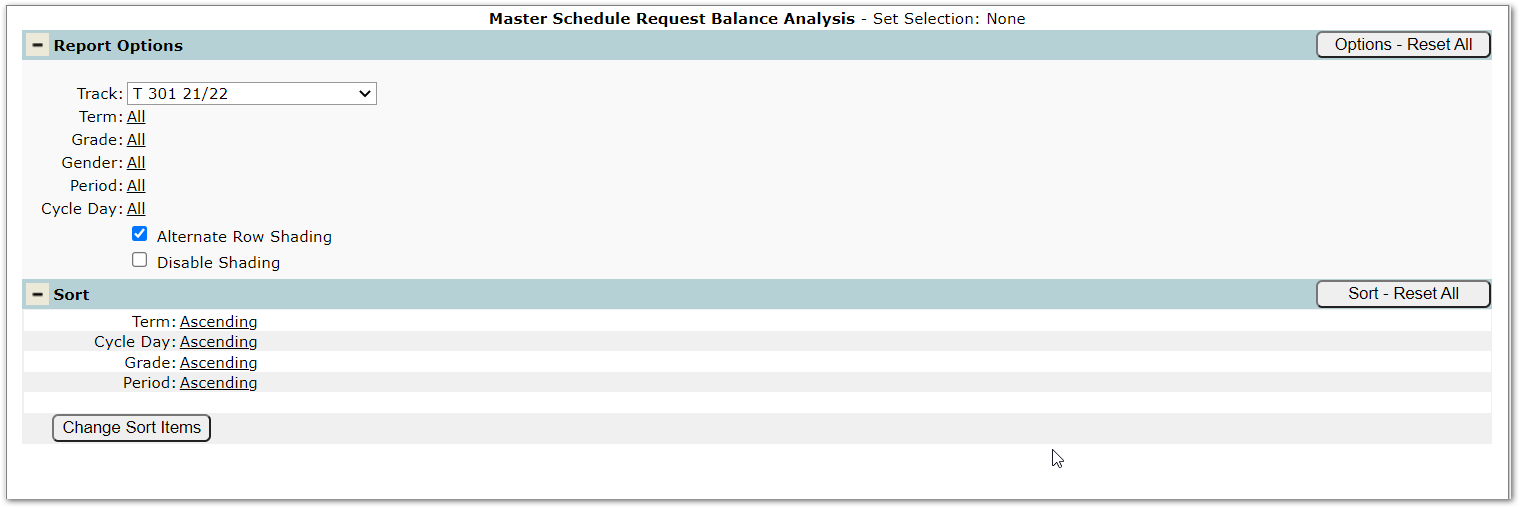
- Track – All tracks for the logged in school are available in the drop-down list.
- Term – Individual terms for the track are available for selection by clicking the All link and selecting the term(s).
- Grade – Defaults to all but individual grades may be selected by clicking the link and selecting grade.
- Period – Defaults to all periods but individual period may be selected by clicking the link and selecting a period.
- Cycle Day – Defaults to all but individual cycle day may be selected by clicking the link and selecting a cycle day.
- Alternate Row Shading – Check box if shading is desired.
- Disable Shading – Check box to disable all shading.
The Number of Students shown in the header represents the total number of active students from the track being processed. If the report sort order is changed to have Grade or Gender listed as the first sort the Number of Students will change to show the total by the first sort item.
Sample Report with default sort order (Term, Cycle Day, Grade, Period)
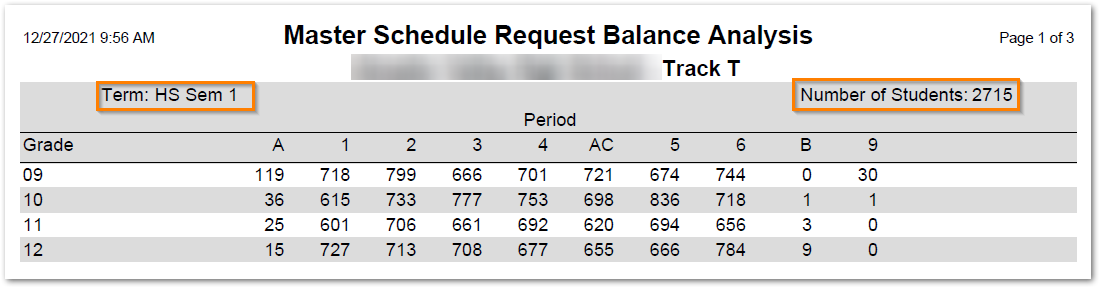
The total number of students listed in above sample report is the total number of students in all grades in the track.
Sample report with Grade chosen as first sort item
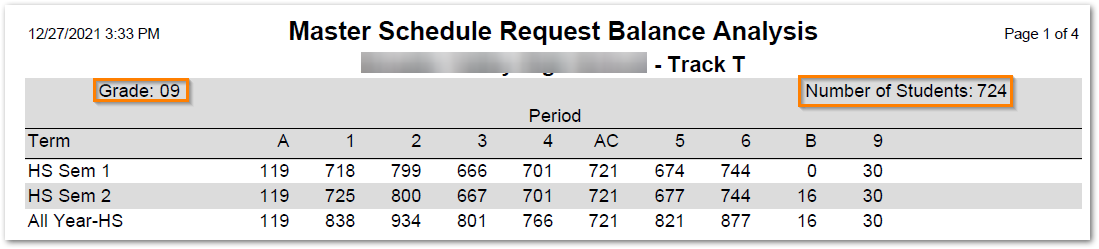
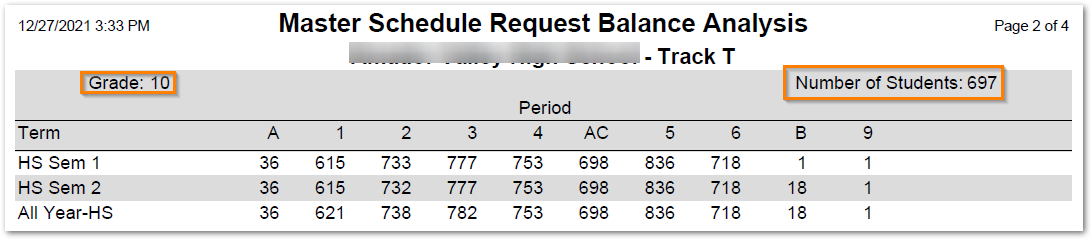
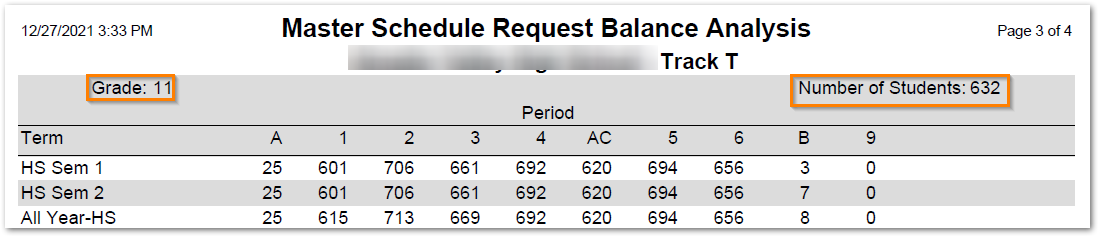
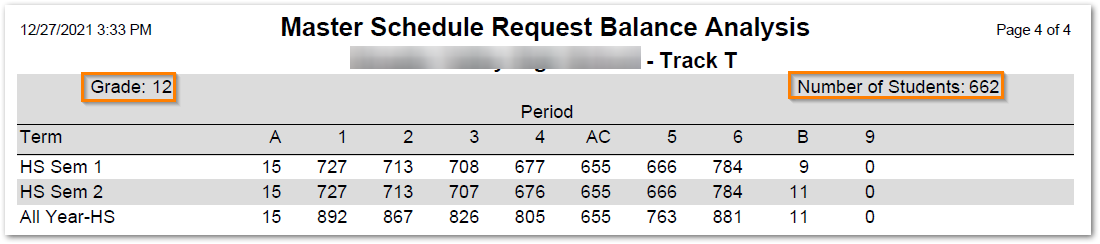
The total number of students listed in above sample report breaks out the total number of students for each grade level due to Grade being the first sort chosen for the track which has grades 9, 10, 11 and 12.
If gender or grade is selected as the first sort, then the comparisons of the student requests against the section capacities for the course are also prorated. For each grade/gender sort, the section sizes are prorated as the section size times the ratio of the grade/gender grouping to the total number of student requests for the course. For example, if 5 9th grade students and 10 10th grade students request a class with a section size of 30, then the 5 9th grade students are compared to a section size of 10 ( size 30 * 5 / 15 students), and 10 10th grade students are compared to a section size of 20.
After all requests have been allocated to meeting times the counts are summarized into the groupings indicated by the sort item order.
The report processing handles track terms as follows. The track is divided up into term buckets, each representing the shortest non-progress report term. For example, in a track with Semester 1, Semester 2, and All Semester terms, the term buckets represent the Semester 1 and 2 terms. When a section has a meeting time in a term that overlaps other terms, the allocations calculated as described above are applied to all included terms. So if a section meets in the All Semester term, the figures are applied to both Semester 1 and Semester 2 meeting times.
As we process each course the proportional counts for each Term/Grade/Period/Cycle/Gender “bucket” are accumulated. When all courses have been processed, we summarize the counts according to the sort order; at this point some of the detail, for example gender and grade, may go away. Gender and grade figures are summed up. Term, period, and cycle day figures are combined by taking the minimum of the allocations across the dimension that is being combined.