
This report generates a table of courses showing the number of students enrolled by grade level as of a user specified date range.
While details specific to this report will follow, users can find general information about reports within the Reports documentation.
Class Size Average Report is located within Reports in the Schedule menu in Q.
Report Options
The following options may be applied to the report:
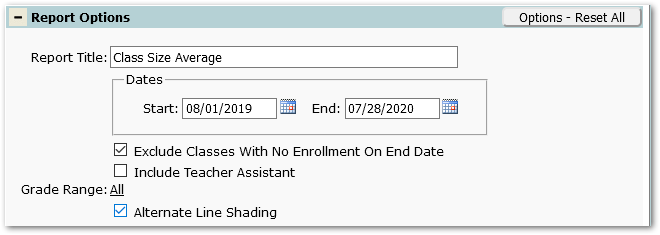
- Report Title – The default title of the report may be edited by the user.
- Dates: Start/End – Select a date range to query. The report defaults from first day of school to the current date.
- Exclude Classes With No Enrollment On End Date – Classes with no enrollment on the End Date will not be included in the report by default unless this option is unchecked. When unchecked, data for those classes within the specified date range will be reported even though there were no students enrolled on the End Date.
- Include Teacher Assistant – Check this box to include TA’s in the enrollment calculation.
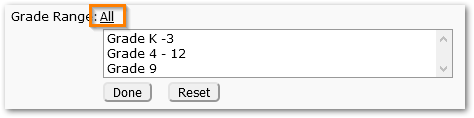
- Grade range – The report default is all grades. Click the selected value to open a sub menu as pictured below. Click the Done button when ready.
- Alternate Line Shading – Applies shading to every other row of the report.
Example Reports
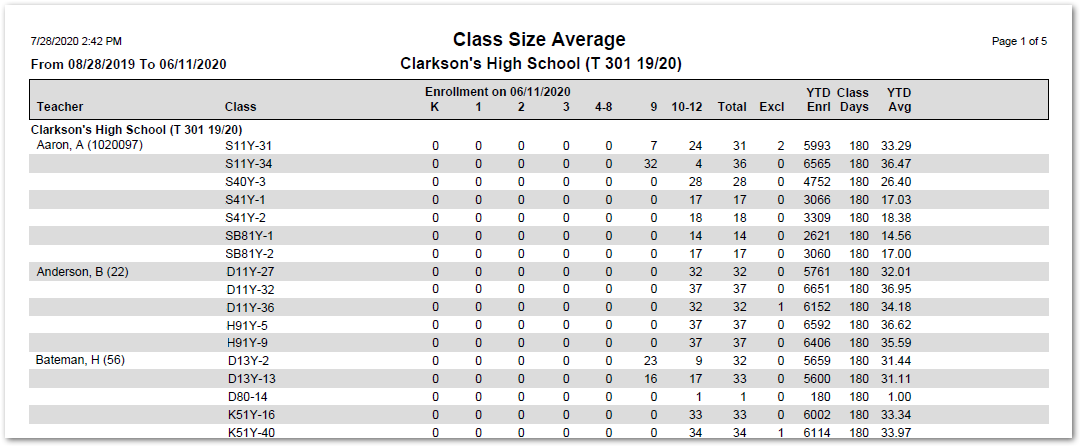
Sample Class Size Average Report
Report Column Details
- Teacher – Course teacher.
- Class – Course section(s) taught by the teacher.
- Grade Levels – Tally of students by grade levels.
- Total – The total enrollment count on the end date used for the report.
- Excl – The number of excluded students (grade level is not K – 12 but otherwise would have been inlcuded).
- YTD Enrl – The total number of enrollment days accumulated by per class. The number includes adds and drops for the class.
- Class Days – The number of class days for the defined date range. Non-class days (e.g. staff development days, holidays, etc.) are excluded from this number.
- YTD Avg – YTD Enrl divided by Class Days.